1) JConsole
JConsole is a simple performance monitoring tool which displays alot of useful information of a running java application. I am using Java 1.7 and JConsole is included in this version. You have to be sure, I guess old java version do not support JConsole, if that happens, you have to upgrade you java.
For local testing, its really straight forward, JConsole provides list of java applications and we have to select one. Then JConsole displays memory, threads, classes related to that application. A nice presentation of these information in graph or table, makes it easy to see if there is any subtle performance problem. If we let it running for long time, we can easily notice if there is any memory leak or system problem with heavy consumption of processor by the application, maybe my huge number of threads creation.
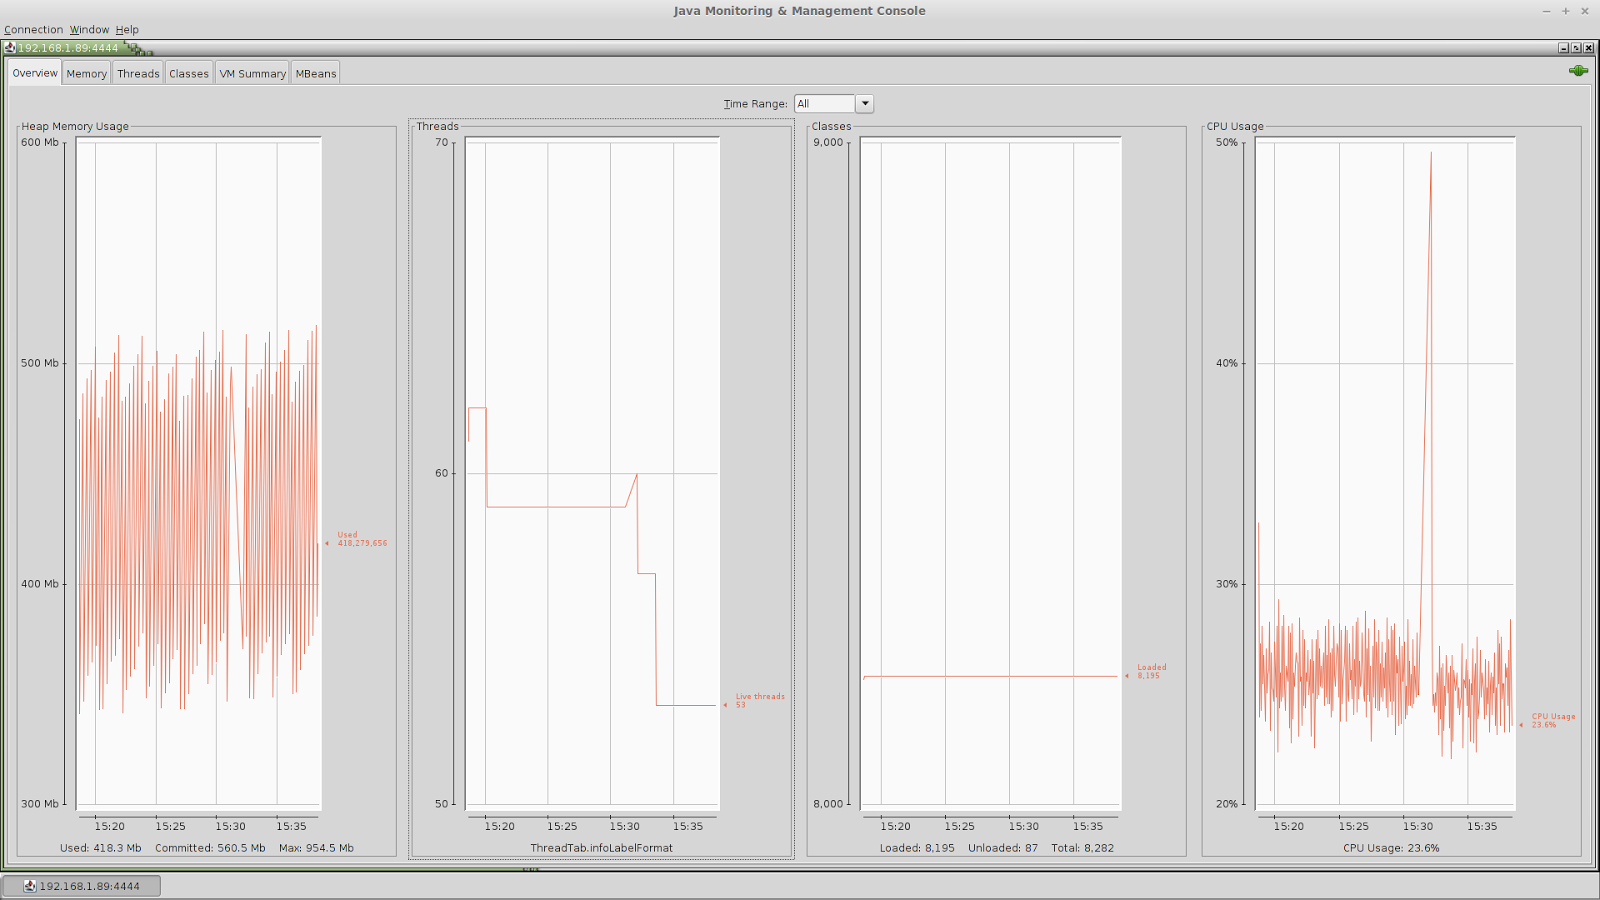
Fig: JConsole
We can remotely connect to the application running in different system through network. For that we have to enable Remove Management and Monitoring Service (JMX) in JVM. If you are running tomcat, its rather straight forward. We just append the following text in the setenv.sh file in $CATALINA_BASE directory.
export CATALINA_OPTS=”-Dcom.sun.management.jmxremote
-Dcom.sun.management.jmxremote.port=
-Dcom.sun.management.jmxremote.authenticate=false
-Dcom.sun.management.jmxremote.ssl=false
-Djava.rmi.server.hostname=
If you want to increase heap memory size, you can append the following line.(this is optional)
export CATALINA_OPTS=”$CATALINA_OPTS -Xms512m”
export CATALINA_OPTS=”$CATALINA_OPTS -Xmx1024m”
Then you have to restart tomcat server. Then we can remotely connect the application running in remote system by using the IP and PORT specified above.
Since JConsole is quite simple, it is used to find out if there are any performance issues in the application. It is the first step for performance monitoring. Normally we run JConsole for a couple of days, and study the performance graph. From the graph, we can speculate whether there are any performance issues or not. If we know that there are performance issues, then the next step is to go for more advanced monitoring tool which is capable of finding specific object or specific thread causing the performance issues. For example, if the application is spawning a lot of threads and creating CPU overhead, then we have to find out which specific threads are creating such problem, or a lot memory is consume by objects and Garbage collector is not successful to release the memory, then we have to find out which specific object is causing such a memory leak.
2) JVisualVM
This is more advanced tool and this is built-in with latest Java. It includes all functionality provided by JConsole, apart from that we can create thread dump, heap dump and application snapshot. The dump files can be analysed later using some other dump analyzer tools to get more performance monitoring. The dump analyzer tools such as JProfiler, YourKit are very nice commercial tools(you can have around 10 days of trial use). I feel really excited if we can find some free analyzer, then we should not bother about paying and licencing.
For remote connection, as mentioned in JConsole, we have to enable JMX in JVM.
3) Automation Approach
Yes, we can dump heap memory as a file, if we want to test it for whole night, but nobody stays in front of computer dumping memory.. lol. So, we should have mechanism that we can dump heap memory in regular interval, so that we can figure out which object is getting bloated with time; also can track the number of threads, and their characteristics.
There is a command line tool jmap which dumps the heap memory. Jmap needs process id to work, so we find out pid of the application from the list of java application using “jps” command from terminal.
This is complete script that can dump heap memory in regular intervals until specified dump files are obtained.
All arguments are optional except PID. Other parameters are user, count and interval(delay for next dump).
4) Eclipse Memory Analyzer
Till writing this text, I found Eclipse Memory Analyzer plugin which can be installed using
http://download.eclipse.org/mat/1.4/update-site/